Show the world

how much your

customers love you

With BARC’s Software Surveys

Providing your prospects with social proof from other customers is a must-have for every vendor

There’s no better way of discovering a vendor’s strengths and weaknesses than finding out how customers rate its product. That’s why so many decision-makers trust BARC surveys when looking for new software.

For you as a software vendor, positive feedback from unbiased customers is the ultimate argument to convince a prospect.

The good news: You have the chance to use the valuable results from our surveys for your own marketing campaigns. Show the world how much users love your product with bulletproof statistics.

What Software Surveys have to offer

The benefits of the BARC'S Software Surveys are manifold.

Attract new visitors

BARC surveys are valuable content for decision-makers who have to decide between different software solutions. Create a lead magnet by making the survey document available on your website.

Convince leads

Oftentimes, reliable statistics showing how much other customers love your product can be all it takes to finally convince a prospective customer.

Level-up your content

BARC surveys make it easy to deliver fresh and useful content written by experts to your readers. The document can be used on all your communication channels, for example on social media, a blog or as a handout at events.

Create awareness

Make sure your product is considered when decision-makers compare different software solutions.

Understand your audience

Find out how your users think you could optimize your product and discover where your strengths lie in comparison to the competition.

Gain insights

Understand how organizations select, implement and use their software solutions and what new trends are emerging.

Reach/Statistics

250

Readers of BARC research worldwide

50

Overall customer reviews

20

Years of BARC research
Our surveys

See where your product fits in

Have a look at our survey schedule and identify the best fit for your product. The focus on a single topic ensures that products are found by the exact target group that is looking for this type of software solution.

Your product will be included in the survey once it receives more than 30 customer reviews.

The BI & Analytics Survey

Field phase start: Beginning of March

Publication: October

The BI & Analytics Survey is BARC’s major annual report on the global business intelligence (BI) software market. It is based on the world’s largest survey of BI users, with a sample of over 3,000 survey responses – that’s why so many companies trust the results of “The BI & Analytics Survey” and base their software purchasing decision upon it.

The Planning Survey

Field phase start: End of October
Publication: May (at our Digital Finance & Controlling event)
The Planning Survey offers an in-depth comparison of up-to-date planning solutions to decision-makers who are looking for new planning software. Use the results of the world’s largest survey on planning software for your marketing. Your prospects are sure to trust the feedback of 1,367 users.

The Data Management Survey

Field phase start: Mid-December

Publication: September 2020

The voice of the data management community: The Data Management Survey is BARC’s new annual report on the data management software market. This BARC survey aims to examine data management products in terms of their functionality, application areas and usability.

How you can benefit from our surveys

Convert Leads with an Individualized Highlights Summary

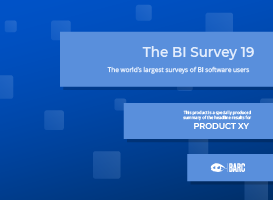
You’ll receive a specially prepared document containing a selection of the headline findings for your product. It does not show all the KPI results and focuses mainly on the positive findings. Among others, it includes:

  • A BARC analyst summary of the positive findings
  • Badges for top rankings
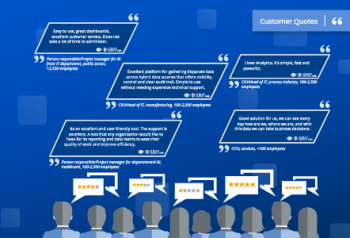
  • Customer quotes
  • BARC analyst comments on every good KPI result
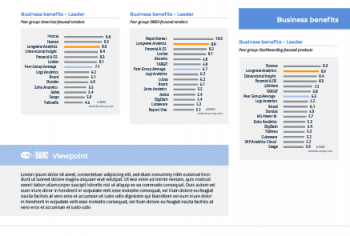
  • A chart for each good result showing a comparison with competitors’ results
  • A concise overview of all the positive findings
This report can be shared with prospects and customers and used for lead generation. You acquire unlimited usage rights to the complete document, which you may distribute freely in printed or electronic format (e.g., for your online lead generation, as a handout at exhibitions and fairs, customer presentations or partner events). You may also use parts of the content in your marketing materials (brochures, white papers, websites, product presentations etc.).

Success with BARC Software Surveys

Components for your campaigns, strategy and product development

Individual highlights documents

A specially prepared document containing a selection of the headline findings for your product. It does not show all the KPI results and focuses mainly on the positive findings. It includes:

  • A BARC analyst summary on the positive findings
  • Badges for top rankings
  • Customer quotes
  • BARC analyst comments on every good KPI result
  • A chart for each good result showing a comparison with competitors’ results
  • A concise overview of all the positive findings
  • User and use case demographics
Use

This report can be shared with prospects and customers and used for lead generation. You acquire unlimited usage rights to the complete document, which you may distribute freely in printed or electronic format (e.g., for your online lead generation, as a handout at exhibitions and fairs, customer presentations or partner events). You may also use parts of the content in your marketing materials (brochures, white papers, websites, product presentations etc.).

Results documents

The Results document explores the most important findings from survey, supplemented by expert commentary. It includes:

  • Headline findings
  • Details of emerging trends
  • A look at how organizations select, implement and use their solutions
Use

These reports are mainly for internal use. Nonetheless, it is possible to use parts of the content (e.g. quotes or charts) in other marketing materials (white papers, blog posts, etc.).

Vendor Performance Summaries

A series of executive reports on each product featured in survey. Each report contains a product review by BARC’s analyst team (Analyst Verdict) plus a summary of the relevant product-related results from the survey (Customer Verdict) giving an overview of its performance across key criteria.

Use

These reports are for internal use only. Content is not allowed to be published or shared.

Website

In honor of our popular surveys, we even created an own website for them, where the main results, as well as a lowdown on each of the featured products, are visualized. bi-survey.com records an annual traffic of 160,000 users from all over the world. Make sure your product is seen here!

Vendors who purchase marketing rights will be featured more prominently on the website and can enhance their profile with:

  • The BARC summary from the highlights document
  • Up to 5 badges from the highlights report
  • Link to a trial version of your product
  • Link to a YouTube product video
  • Up to 5 screenshots from your product
  • Up to 5 quotes from the highlights report (from BARC Analysts or Customers Quotes)
  • Up to 5 charts from the highlights document
  • A hero banner
  • Your company logo

Analyzer

The Analyzer is a powerful, interactive, online tool that enables you to perform your own custom analysis of the survey data. The survey results can be filtered by region, country, product used, industry and company size and you can make quick comparisons between the tools you are interested in.

Additional documents (depending on survey)

Depending on the survey there are additional documents like The BI Survey Best Practices or the BI Trend Monitor which are part of the core components.

Core Components

The components which are included in the basic survey offering.

Additional components

Individual interactive highlights Analyzer

Interactive online tool enabling users to explore the headline results of your product as well as allowing them to perform custom analysis of the (non-product-related) survey data.

Videos

Attractive individual infographic videos, showcasing your product’s headline results.

Strategy workshop

Strategy consulting based around your BI Survey results (one-day workshop).

Infographic

Attractive individual infographic, showcasing the headline results for your product.

Blog posts

Blog contribution for marketing purposes. This only covers general, product-independent survey findings and does not extend to discussing product-specific results.

Other languages

Marketing rights for another language, including translation service for the highlights document.

Ready to make the next move?

Get in touch today.

Contact Us